The Times — World Cup
July 2010
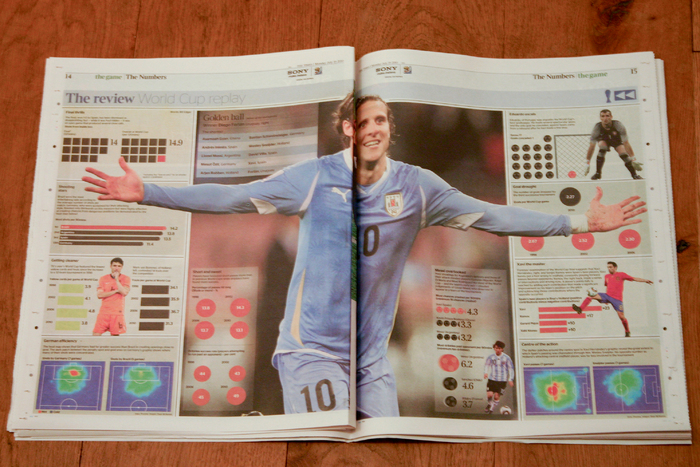
Data visualization for The Times in London, focusing on the 2010 World Cup. Detailed data of plays and positions were aggregated across teams and players, with the goal of creating "at a glance" graphics, telling an instant story about the cup as a whole.
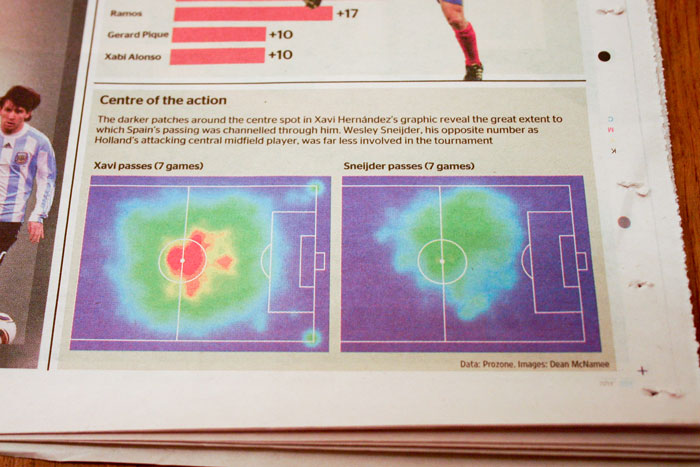
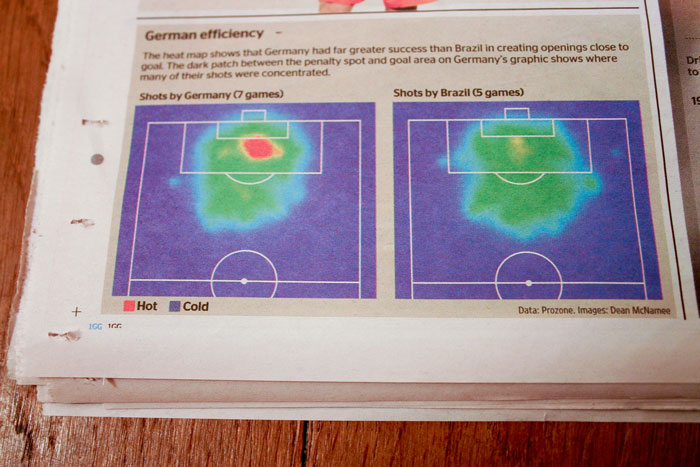
Custom software analyzed shots, passes, and tackles across players and teams, generating hundreds of heatmap graphics mapping these plays across the football pitch.
Four of the graphics were printed in Monday July 19th's edition of The Times.
All of the graphics were published in the online edition of The Times, along with an interactive 3D visualization of tackles by team. The 3D visualization software was custom written in JavaScript and HTML5, creating an engaging and interactive experience across platforms and mobile devices including the iPad.
A republished version of the 3D visualization is available here.